We're excited to introduce the Report Dashboard, a powerful new feature that makes it easier than ever to track and analyze your organization's event data.
Whether you're looking to assess event participation, measure employee engagement, or dive deeper into survey feedback, the Report Dashboard offers a comprehensive overview to help you make data-driven decisions that elevate your future events.
Who Can Access the Report Dashboard
Before diving into the dashboard features, it’s important to know who can access this powerful tool:
-
Company Admin Users
On the flip side, the following users do not have access to the Reports page:
-
Company Manager users
-
Company Employee users
If you want to manage your acceses please refer to the following article: User Roles and Permissions.
Report Usage
Filters
We know that every organization has different reporting needs. That’s why the Report Dashboard includes two easy-to-use filters to help you drill down into the data that matters most to you:
- Event Date: Want to see how your events performed over a specific time period? With this filter, you can view reports for individual event dates or date ranges.
-
Event Format: Filter your reports by specific event formats (e.g., in-person, virtual, hybrid) to compare performance across different types of events
By default, the dashboard shows all events across all formats and dates, but once you apply a filter, all widgets and reports will update to reflect your selection. It's that simple!
Account Overview Widgets
The Account Overview section is designed to give you a high-level snapshot of your organization's completed events performance. This includes six key widgets, so you can track the most important metrics at a glance:
-
Event Participants - See the total number of attendees for all your completed events on the Visit.org platform.
-
Event Registrants - View the number of people who signed up for events on the Visit.org platform.
-
Volunteer Hours - Calculated by multiplying event duration by number of attendees for each completed event.
-
Total Events - Track the number of events completed within your selected date range (excluding canceled, upcoming, or rescheduled events).
-
Average Participants per Event - Average participants per event for completed events in the given date range.
-
Average Attendance Rate - This widget tracks how many registrants actually attended your events, providing valuable insights into engagement. This excludes events without registration data.

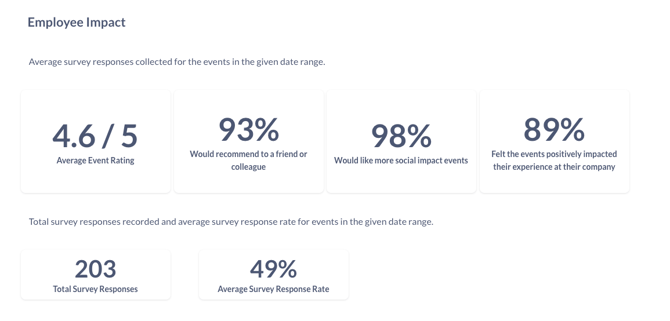
Measuring Employee Impact
If you’re using your events to foster employee engagement or corporate social responsibility, the Employee Impact section is where you'll find the insights that matter. Here, we include six widgets that provide aggregated data from post-event surveys:
-
Average Event Rating
-
Would recommend to a friend or colleague
-
Would like more social impact events
-
Felt the events positively impacted their experience at their company
-
Total Survey Responses
-
Average Survey Response Rate
Dive Deeper with the Survey Responses Report
For those who want even more detail, the Survey Responses report is your go-to tool. This feature provides a comprehensive look at survey data for each completed event, including:
- Aggregated responses to every survey question.
- The total number of responses received.
- The survey response rate.
Sort the data chronologically or use the arrows to navigate between events, so you can easily track trends over time. Whether you're analyzing a single event or comparing multiple events, this tool gives you the information you need to improve your programs.
 Visualize Your Event Performance
In addition to the data widgets, the Events Section offers a powerful line chart that compares month-over-month event registrations vs. attendance. This chart is your go-to tool for spotting trends in engagement over time, so you can understand what's working (and what isn't).
If you're looking for more granular insights, the Event Detail Report provides a list of all completed events, with key metrics like:
- Total registrations
- Attendance numbers and attendance ratios
- Average ratings
- Volunteer hours
- Donations made to your partner organizations
As with the other reports, you can scroll right through the data and sort by date to track progress over time. The report is sorted chronologically by default, showing the most recent completed events first. Use the arrows at the bottom right of the report to view older events.

Ready to Take Your Event Tracking to the Next Level?
With the Report Dashboard, you have everything you need to analyze, optimize, and improve your events—whether you're focused on participation, employee engagement, or social impact. The intuitive filters and widgets make it easy to get the insights you need, so you can make informed decisions that drive greater success for your organization.
Don’t miss out on all the amazing features the Report Dashboard has to offer! Start exploring today and discover just how easy it is to harness the power of your event data.